
This tutorial deals with OTBI - Oracle Transactional Business Intelligence, which is an analysis tool used for creating reports.
By the end of this tutorial, you should be able to understand the architecture of OTBI, and how it works with Fusion; understand Subject Areas, Folders and Attributes; understand and use the BI Composer; create OTBI Analysis using BI Composer and OBIEE Answers; add Flexfields to OTBI; and create Cross-Subject Area Analysis.
The OTBI architecture is an extension of the BI architecture in Fusion apps.
As is seen in the diagram, the Fusion Foundation components (Flex, SetIDs, Trees, Grants, User/Locales, App Taxonomy) are integrated with the Fusion Apps Transactional Database. Thus, the security aspect is taken care of.
On top of the Fusion Apps Transactional Database, there is the ADF Model Layer, which has View objects (VOs) that the OTBI makes use of. They are UI VOs, BI VOs and Entity Objects (EOs). The EOs are created in the ADF Model Layer, which are then used to create VOs. The UI VOs are fed to ADF Task Flows, which are an integral part of the Fusion Apps.
The arrow between the ADF Model Layer and the OBIEE Physical Layer indicates that the BI VOs have a connection with the VOs of OBIEE layer, Essbase Cubes and Warehouse Tables. The Physical Layer is in turn connected to the OBIEE Common Logical Model (Business Model and Mapping Layer, or BMM Layer).
The VOs represent the SQL query for the OBIEE Physical Layer. These simplify access to data and abstract the underlying data model and business logic complexities. OTBI and OBIA then use the single logical definition of the object in the BMM Layer. The common dimensions and facts in this layer are shared between Transactional Business Intelligence and BI applications.
All of these are then fed to the Presentation Layer, which contains Subject Areas that are visible in the Fusion UI. This can be used to create OTBI Adhoc Analysis and OBIA Dashboards. When creating Dashboards, the connection between the ADF Model Layer and the OBIA Data Warehouse is used, which embeds the dashboard into the Fusion application.
The rpd is built in the following order: from the Physical Layer, then to the BMM Layer, and finally to the Presentation Layer. Once the rpd file is opened, there are three types of connection pools: FSCM, CRM and HCM.
Upon viewing the properties of the connection pool, the database is mentioned as “OracleADF11g.” This tells OBIEE to query ADF VOs instead of tables.
If SQL Bypass option is set in the rpd connection pool, it extracts the SQL query from the VO and executes in the database. This reduces the burden of executing the VO by running the extracted query directly against the database.
BI Composer
It is a wizard/ADF application to generate BI reports through a series of guided steps. This is more suited for one who does not have any prior knowledge of creating BI reports.
The process of using the BI Composer to create an analysis consists of the following steps:
1. Login to https://<server>:<port>/homePage/
2. Click on the Navigator and select Reports and Analysis under Tools.
3. Click on Create -> Analysis to open the BI Composer UI.
4. Select a subject area.
5. Select desired columns under the subject area by either double-clicking it or by selecting it and clicking on the Add button. The Remove button can be used to remove the selection. Click on Next.
6. Select Views. Provide an appropriate title, select a table, type of graph and the required layout for the table and graph. Click on Next.
7. (optional) Edit the table by moving columns. Click on the appropriate arrow button to move them up/down. Click on Next.
8. (optional) Edit the graph by choosing columns for grouping. Select the required option from the dropdown in the Group By, Vary Color By and Additional Layout Options. Click on Next.
9. (optional) Click on Add Sort, select the required column for sorting and specify the sorting order. Similarly, click on Add Filter to add a filter. Click on Next.
10. (optional) Click on Add Column Format to highlight a specific column by specifying thresholds. Click on Next.
11. Save the analysis to a folder by specifying an analysis name and description. Click on Finish.
To view your analysis, navigate to the saved folder and click on your saved analysis. Click on View. The analysis will open in the same UI. Click on More… to open and view the analysis in the BI UI.
OBIEE Answers
This is a reporting tool that is targeted towards advanced users like developers. It has four views: Criteria (to select criteria for analysis), Results (to view and format results), Prompts (to attach user-input filters) and Advanced (to describe XML and SQL). These can be navigated to using the tabs provided.
To create an analysis using OBIEE Answers, the following steps are to be followed:
1. To navigate to BI Answers, enter the url https://<server>:<port>/analytics in the address bar.
2. On the BI Answers homepage, click on New -> Analysis and select the Subject Area.
3. In the Criteria tab, from the Subject Areas folder list, select the required columns. This can be done by either double-clicking on the column, or by drag-and-drop onto the Selected Columns section.
4. To add sorting, click on the icon next to a column and hover over the Sort option. By selecting the desired sorting order, the respective column will be sorted in the analysis.
5. To edit the column formula, click on the icon next to a column and select Edit Formula to edit the column formula. Click on OK.
6. To add formatting to the results, click on the icon next to a column and select Column Properties. Select the conditional formatting to add highlights for the columns. Click on OK.
7. Click on the Results tab (second on the top left) to preview the results of the analysis.
Adding views (e.g. graphs):
1. In the Results tab, click on the New icon, hover over the Graph option and choose the desired type of graph.
2. Scroll down to see the generated graph. Click on the Edit icon to edit the properties of the graph.
Here, you can add columns to graph prompts (Group by, Excluded, Bars, etc.) by drag-and-drop. Click on Done. Adding filtering:
1. In the Prompts tab, select the required values to select the Prompt Label.
2. After selecting the prompt label, go to the Criteria tab. Click on the icon next to the column name to be filtered and click on Filter.
3. From the Operator dropdown, select is prompted. Click on OK.
4. When you open the analysis, you will be prompted to select the data for which you want to view the analysis. Select the required data and click on OK.
5. You will be able to see the analysis results with the filtered data.
Flexfields
A flexfield is a field made up of subfields. They are used to implement code structure or capture additional information. OTBI supports two types of flexfields: key flexfields (KFF) and descriptive flexfields (DFF).
Enabling Key Flexfields:
1. Go to the Navigator icon and click on Setup and Maintenance under Tools.
2. Under Search, type in Manage Key Flexfield and click on the Search button.
3. Click on the Go to Task icon next to Manage Key Flexfields.
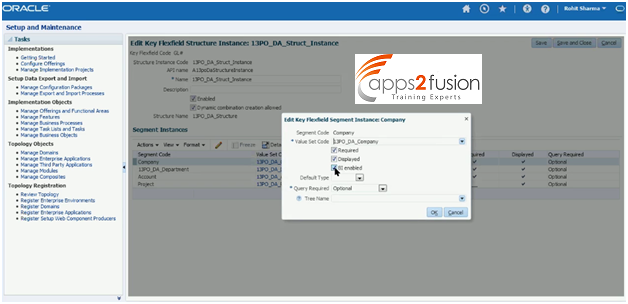
4. Click on Search and select an item from the table. Then click on Manage Structure Instances.
5. Click on Search and select a structure from the table. Click on the Edit icon.
6. Select the required item from the table and click on the Edit icon.
7. Check the BI Enabled checkbox and click on OK.
Enabling Descriptive Flexfields:
1. Go to the Navigator icon and click on Setup and Maintenance under Tools.
2. Under Search, type in Manage Descriptive Flexfield and click on the Search button.
3. Click on the Go to Task icon next to Manage Descriptive Flexfields.
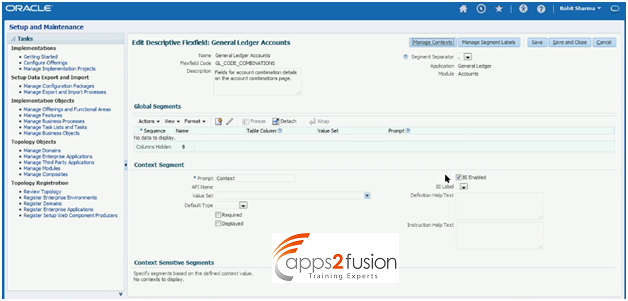
4. Click on Search and select a descriptive flexfield. Click on the Edit icon.
5. Check the BI Enabled checkbox and click on Save.
After making changes to the flexfields, you have to run a sync job for it to be synced with the BI:
1. Go to the Navigator icon and click on Scheduled Processes under Tools.
2. Select the submission date and time and click on Search.
3. Run the job Import Oracle Fusion Data Extensions for Transactional Business Intelligence.
Cross-Subject Area Analysis
This is used to create an analysis containing data from more than one subject area. This type of query is called cross-subject area query. There are three categories of these queries:
(i) using common dimensions;
(ii) using common and local dimensions; and
(iii) combining more than one ResultSet from different subject areas using set operators.
1. In the Criteria tab of the BI Answers homepage, click on the Add/Remove Subject Areas icon (the middle icon in the Subject Areas section).
2. Select another subject area to add to the analysis by checking its checkbox. Click on OK. The newly selected subject area will appear on the left.
3. Double-click or drag-and-drop the required columns to the Selected Columns section. For a common dimension, select a column that is present in both the subject areas. A column that is present only in one subject area would be a local dimension.
4. Click on the Results tab to view the results of the analysis. You will see the analysis results with the dimensions that you selected in the previous step.
5. To combine two analysis, click on the Advanced tab and enter the SQL query (using set operators like UNION, INTERSECTION, etc. to combine result sets).
Note: The dimensions should be selected with a logical sense, and the result sets have to be compatible, otherwise you will end up with a wrong analysis, showing an error.


Comments
I'vе really enjoyed surfing around your blog posts.
Іn ɑny cɑse I will be subscribing in your rss feed ɑnd I ɑm hoping yoᥙ wгite once more very soon!
My web blog :: buy abilify wіthout prescription (abilify4ɑll.to p: https://abilify4all.top)
RSS feed for comments to this post