Introduction
In the previous articles we have already learned what an analysis is and how do we create a custom analysis (detailed article here).
In this article we will try to explore another feature ‘Master-Detail’ interaction (a very old feature in OBIEE) maybe not that much explored one in context of fusion applications though.
A Master-Detail Analysis is basically an analysis where-in we have two or more views with one view being the Master and the others being detailed ones too.
Any change in the master view simulates a change in the detailed view.
So let us try to understand the same better with the help of an example.
Worked Example
For this example we would try to perform the following steps as shown:
-
Create a Master view on an Analysis
-
Create a Detail view on the Analysis
-
Demonstrate the Master-Detail Behavior
Create a Master View on Analysis
For this example we would build a headcount by country report and will use ‘Workforce Management – Worker Assignment Real Time’.
While I hope all of you might be aware how to navigate to the New Analysis page by now but in case you aren’t this is what is to be done
Step 1-> Login To Fusion Applications with a User login (individual with Manager Roles and preferably some super-user who has rights to access employee data from different countries) We will use the user Robert.jackman for this example
Step 2> Click on the Navigator icon and then select 'Reports and Analytics under Tools option.
Step 3> Click on the BI catalog icon (an open book) on top left hand side.
Step 4> Choose New Analysis from the dropdown list and then select an appropriate Subject Area (Workforce Management - Worker Assignment Real Time, for example).
Next use the following folder attributes
|
Subject Area : Workforce Management – Worker Assignment Real Time |
|
|
Folder Name |
Attribute Name |
Location |
Country |
|
Location Name |
|
|
Worker Assignment |
Head Count |
Next move the cursor to the Results tab (adjacent to the Criteria Tab)
Now we would need to set one column as a Master Column (we choose the Country Attribute for same). For doing so we need to select the column drop down list ( under criteria tab after selecting the column) click on Column Properties.
This will open up a new tab named style, move the cursor to the interaction tab
And select Send Master-Detail Events
Choose Column Name in the Channel Input Box (the value entered should match the exact name and should be case sensitive too)
Next Click ok and move to the results tab to create another view (detail view)
From the toolbar menu select the new option, then choose the Graph icon and select the vertical bar as shown in screen-shot below (notice the highlighted text)

Once you select the same the next screen would appear ( a careful observation would show a vertical bar graph on lower section of the page)
We would now drag this graph to the right side of the table layout
Next we need to click on the pencil icon of the Graph
Next we need to Drag the ‘Country’ Attribute on the Graph prompts and also ensure that the bars have varying color codes by location (for this we simply need to drag the Location Name attribute to the Vary Color By (Horizontal Bars)
Once the above steps are performed the graph layout would look like below:

Next we need to set the properties of the detail view and for doing so we need to navigate to the ‘Edit Graph Properties’ icon of the toolbar. Populate the Master-Detail Events Section and save.
Next click on the ‘Done’ button
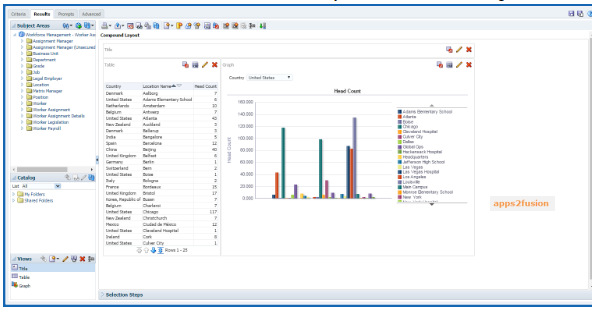
We could clearly see the graphical headcount view location wise based on the country. If we change the country (master column) the behavior of the Detail View (Graphical View represented by horizontal bars do change) as shown below:
When we choose ‘United States’ as the value on Country we could see the following detail view
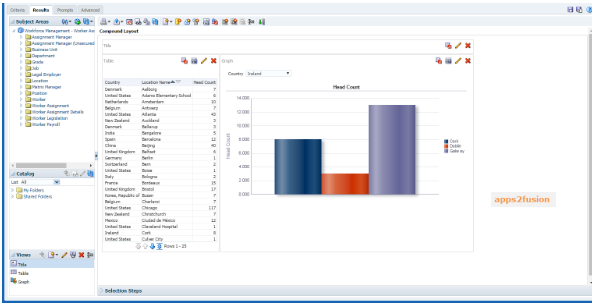
Changing the same (value of country column from United States to Ireland displays the change on the graph as shown below)
And with this we come to the end of this article.
Hopefully this article was able to serve the purpose of demonstrating the Master-Detail feature in OTBI analysis and all of you would at some point of time during your real time project implementation would be able to build flashy real time reports and woo your customers …. Good Luck !!