Introduction
Most of us must have created multiple BIP Reports where we display data in Tabular format. However, there are some scenarios there are some specific kind of reports like headcount reports, revenue reports , sales reports, forecast reports etc. which are best viewed making use of charts (bar graph, horizontal graph, pie charts).One can easily embed such charts and graphs in OTBI Analysis by adding different views to the Compound Layout but what if we want to have the same featured in BI Report which has SQL as the data source. One can achieve this by creating a custom template.
In this example, we will demonstrate this.
We can broadly classify the entire process into two categories:
-
Create Data Model based on SQL query
-
Create Layout Template
Create Data Model
We would use a query which will fetch the count of workers (Employee Count, Contingent Worker Count and Total Headcount)
|
SQL Query |
|
SELECT paam.LEGISLATION_CODE ,SUM(DECODE(paam.SYSTEM_PERSON_TYPE,'EMP',1,0)) EmployeeCount ,SUM(DECODE(paam.SYSTEM_PERSON_TYPE,'CWK',1,0)) CWKCount ,Count(*) TotalCount FROM ( SELECT papf.person_id,papf.person_number ,(SELECT ppos.period_of_service_id FROM per_periods_of_service ppos WHERE ppos.person_id = papf.person_id AND TRUNC(SYSDATE) BETWEEN ppos.date_start AND NVL(ppos.actual_termination_date,TO_DATE('12/31/4712','MM/DD/YYYY')) AND primary_flag = 'Y') period_of_service_id -- Primary flag is Y to indicate the primary work relationship for that legal employer within that period. This flag is set to Y when worker has moved beyond Pending Worker. Within the legal entity only one relationship can be primary FROM per_all_people_f papf WHERE 1 = 1 ) TablePerson, PER_ALL_ASSIGNMENTS_M paam WHERE 1 =1 AND paam.period_of_service_id = TablePerson.period_of_service_id AND TRUNC(SYSDATE) BETWEEN paam.effective_start_date AND paam.effective_end_date -- Include only Employee and Contingent Worker AND paam.system_person_type IN ('EMP','CWK') --Get Only Active and Suspended records AND paam.ASSIGNMENT_STATUS_TYPE IN ('ACTIVE','SUSPENDED') AND paam.primary_assignment_flag = 'Y' AND paam.effective_latest_change = 'Y' GROUP BY paam.LEGISLATION_CODE ORDER BY 4 desc |
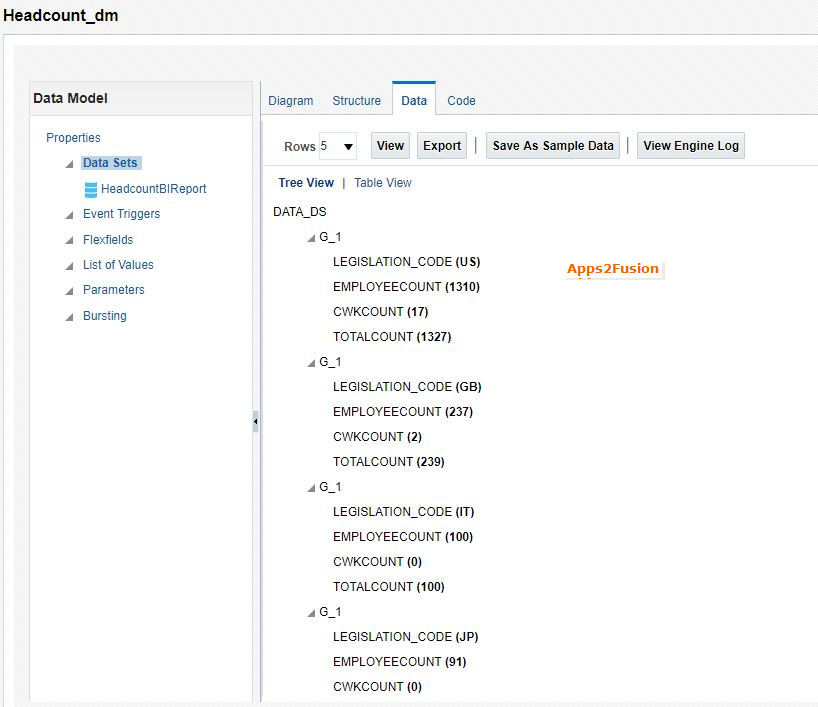
The Data Model when created will have sample data as below:
Create Layout Template
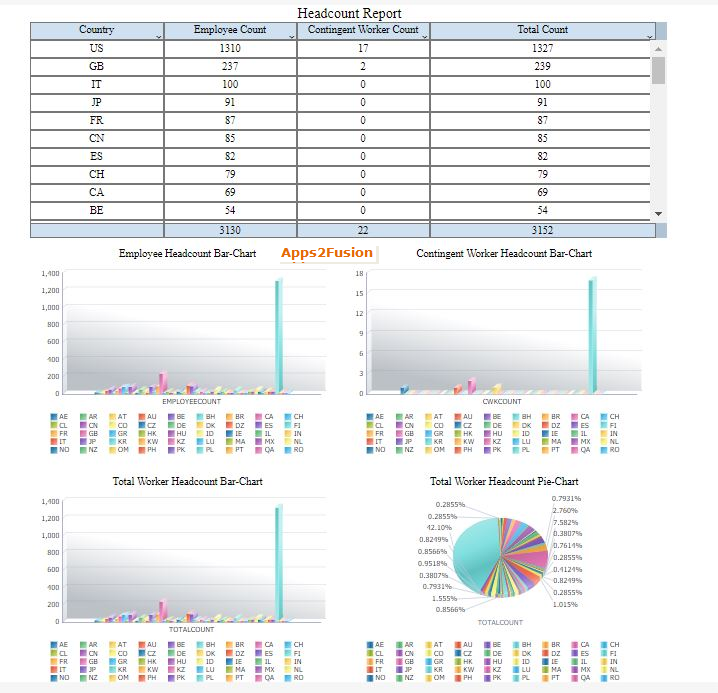
We will create a custom template which will contain:
-
Data Table
-
Bar Chart Showing Legislation Wise Employee Count
-
Bar Chart Showing Legislation Wise Contingent Worker Count
-
Bar Chart Showing Legislation Wise Total (Employee + Contingent Worker) Count
-
Pie Chart Showing Legislation Wise Total Worker Distribution
The template would appear as below

And when we run the report we can see the report output